Achieved Profitability in 2018 With Cost Rationalization Measures and Strong Fourth Quarter Revenues
HACKETTSTOWN, NJ — April 1, 2019 — Vislink Technologies, Inc. (“Vislink” or the “Company”) (Nasdaq: VISL), whose brands are recognized as the global leaders in live video communications, announced its results for the fourth quarter and year ended December 31, 2018. Management will hold a conference call to discuss the results on Monday, April 1, 2019 at 5:00 p.m. Eastern Time (details below).
2018 Highlights:
- Revenues were $10.95 million for Q4 2018 and $37.9 million for the full year on a Non-GAAP basis.
- Achieved profitability of $600,000 and $391,000 on a Non-GAAP basis1 for Q4 2018 and the full year, respectively.
- Removed $9.5 million in costs from the business by streamlining operations, eliminating redundant personnel and consolidating facilities.
- Received orders during the year valued at several million dollars to provide airborne video downlink surveillance to law enforcement agencies and the US military.
- Debuted a new helmet and body-worn RF video transmission system designed for tactical applications for the armed forces and law enforcement agencies.
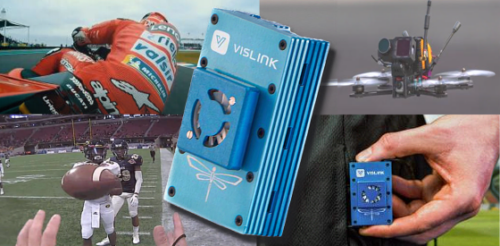
- Deployed its technology to power referee cap-worn transmitters at the NCAA College Football championship games, which provided compelling looks and unprecedented angles for viewers at this high-profile sporting event.
- Released a significant upgrade to the HCAM and Ultra Receiver wireless camera solution. The system now provides single-frame end-to-end latency for 4K UHD transmissions for the first time in the industry.
- Implemented its onboard video technology at the Moto America Superbike Championship Racing Event. This ultra-compact technology is used to capture live video at high speeds. After successfully deploying it at the prestigious MotoGP and numerous other top-tier sporting events around the world for over a decade, it is now being used in the U.S.
- Announced a new joint collaboration with long-time strategic partner Panasonic, integrating the HCAM 4K system with the Panasonic studio camera ranges.
“We are pleased to report that in Q4 2018 we reached our goal of achieving profitability,” said Roger Branton, CEO of Vislink Technologies. “This was the result of the company-wide measures we put in place beginning in Q2 that were essential for rightsizing our operations. Throughout the year, we focused on implementing our cost reduction measures and setting the company on a course to achieve profitable and stable revenue growth. With these measures substantially completed, we were able to end the year in a stronger position.”
Mr. Branton continued. “Now that we’ve underpinned the company with operational stability, we have turned our attention to growing the business. We started to see the results of this with strong fourth quarter revenues. Looking forward, we’re planning an aggressive push into promising new sectors of our traditional markets, as well as markets outside our traditional ones. We have also evaluated strategic relationships including M&A opportunities, with a focus on streaming and other services that complement our existing solutions.”
GAAP RESULTS
- For the year ended December 31, 2018, revenue was $38.3 million compared to $47.8 million for the year ended 2017.
- Gross margins were 50% of revenue for the year ended December 31, 2018, compared to 41% of revenue for the year ended December 31, 2017.
- For the year ended December 31, 2018, net loss attributable to common shareholders was $14.9 million, or $(0.90) per share, compared to net loss of $10.4 million, or $(0.85) per share for the year ended December 31, 2017.
- EBITDA for December 31, 2018 was a negative $9.2 million compared to a negative $5.5 million for the year ended December 31, 2017.
- Ended the fourth quarter 2018 with $2 million in cash compared to $2.8 million at December 31, 2017.
NON-GAAP RESULTS¹
- For the year ended December 31, 2018, adjusted revenue was $37.9 million compared to $48.8 million for the year ended 2017.
- Adjusted Gross margins were 49.7% of revenue for the year ended December 31, 2018, compared to 49.3% of revenue for the year ended December 31, 2017.
- For the year ended December 31, 2018, adjusted net loss attributable to common shareholders was $1.4 million, compared to net income of $3.2 million for December 31, 2017.
- Adjusted Earnings before interest, taxes, depreciation and amortization (EBITDA) for December 31, 2018 was a positive $391,000 compared to $6 million for the year ended December 31, 2017.
Financial Results Conference Call
Management will hold a conference call to discuss financial results for the year ended December 31, 2018 and provide a corporate update on Monday, April 1, 2019 at 5:00 p.m. Eastern Time. To participate in the conference call, please call 1-866-987-9124 (toll free) or 1-409-217-8842 (international call-in) and ask to join the Vislink Technologies 2018 call. The call will also be simultaneously webcast. Listeners can access the webcast live through the Company’s website at https://vislinktechnologies.com/investor-information/. For those who cannot participate in the call, an audio replay will be made available on the Vislink Technologies website.
¹NON-GAAP FINANCIAL MEASURES
We disclose non-GAAP financial measures as we believe they provide useful information on actual operating
performance. Readers are cautioned that non-GAAP financial measures do not have any standardized meaning prescribed by U.S. GAAP and therefore may not be comparable to similar measures presented by other companies.
Non-GAAP gross margin excludes the impact of purchase price amortization on the step up of assets as a result of the bargain purchase gain and the impact of foreign exchange gains or losses.
Non-GAAP income (loss) from operations excludes the impact of purchase price amortization related to the Vislink acquisition, acquisition-related expenses and restructuring expenses.
We use the above-noted non-GAAP financial measures for planning purposes and to allow us to assess the performance of our business before including the impacts of the items noted above as they affect the comparability of our financial results. These non-GAAP measures are reviewed regularly by management and the Board of Directors as part of the ongoing internal assessment of our operating performance. Adjusted EBITDA is defined as net income (loss) plus purchase price amortization, acquisition-related expense, restructuring expense, depreciation and amortization, foreign exchange gains or losses and interest expense.
Adjusted EBITDA is a metric used by investors and analysts for valuation purposes and we believe that it is an important indicator of our operating performance.
About Vislink Technologies, Inc.
Vislink Technologies brands are recognized as the global leaders in the design, manufacture and deployment of end-to-end live video communications solutions. They are trusted suppliers to tier-1 customers in broadcast/sports/entertainment, and law enforcement/public safety/defense markets. Their products are recognized for high levels of performance, reliability, build quality, extended operating ranges and compact form factors. In the broadcast, sports and entertainment sectors, IMT and Vislink provide high-definition communication links to reliably capture, transmit and manage live event footage. In the law enforcement, public safety & defense markets, IMT and Vislink provide secure video communications and mission-critical solutions to local, national and international agencies and organizations. Headquartered in Hackettstown, New Jersey, Vislink Technologies has over 70 patents and pending patent applications. More information can be found at www.vislinktechnologies.com.
# # #
Note on Forward-looking Statements
This press release may contain projections or other forward-looking statements within the meaning of the Private Securities Litigation Reform Act. These statements involve risks and uncertainties, and actual events or results may differ materially. Among the important factors that could cause actual results to differ materially from those in the forward-looking statements are the risk that our reduction in operating expenses may impact our ability to meet our business objectives and achieve our revenue targets and may not result in the expected improvement in our profitability, the fact that our future growth depends in part on further penetrating our addressable market and also growing internationally, and we may not be successful in doing so; our dependence on sales of certain products to generate a significant portion of our revenue; the effect of a decrease in the sales or change in sales mix of these products would harm our business; the risks that an economic downturn or economic uncertainty in our key U.S. and international markets may adversely affect demand for our products; difficulty in accurately predicting our future customer demand; the importance of maintaining the value and reputation of our brand; and other factors detailed in the Risk Factors section of our Registration Statement on Form S-1, as amended (No. 333-225975), which is on file with the Securities and Exchange Commission. Additional information will also be set forth in our Annual Report on Form 10-K for the year ended December 31, 2018. These forward-looking statements speak only as of the date hereof or as of the date otherwise stated herein. The Company disclaims any obligation to update these forward-looking statements.
FOR MORE INFORMATION:
Daniel Carpini
941-953-9035
daniel.carpini@vislink.com
Investor Relations:
John Marco/CORE IR
516-222-2560
johnm@coreir.com
VISLINK TECHNOLOGIES, INC. (f/k/a xG TECHNOLOGY, INC.) AND SUBSIDIARIES
CONSOLIDATED STATEMENTS OF OPERATIONS AND COMPREHENSIVE LOSS
(IN THOUSANDS EXCEPT NET LOSS PER SHARE DATA)
| For the Years Ended | ||||||||
| December 31, | ||||||||
| 2018 | 2017 | |||||||
| Revenue, net | $ | 38,294 | $ | 47,824 | ||||
| Cost of Revenue and operating expenses | ||||||||
| Cost of components and personnel | 19,192 | 28,220 | ||||||
| Inventory valuation adjustments | 473 | 1,781 | ||||||
| General and administrative expenses | 21,817 | 27,015 | ||||||
| Research and development | 7,873 | 9,799 | ||||||
| Impairment charge | 413 | — | ||||||
| Amortization and depreciation | 2,953 | 4,398 | ||||||
| Total cost of revenue and operating expenses | 52,721 | 71,213 | ||||||
| Loss from operations | (14,427 | ) | (23,389 | ) | ||||
| Other (expenses) income | ||||||||
| Changes in fair value of derivative liabilities | 3,186 | 105 | ||||||
| Gain on bargain purchase | — | 10,911 | ||||||
| (Loss) gain on debt and payable extinguishment | (1,060 | ) | 2,900 | |||||
| Other income (expenses) | 146 | (251 | ) | |||||
| Interest expense | (2,718 | ) | (629 | ) | ||||
| Total other (expenses) income | (446 | ) | 13,036 | |||||
| Net loss | $ | (14,873 | ) | $ | (10,353 | ) | ||
| Basic and diluted loss per share | $ | (0.90 | ) | $ | (0.85 | ) | ||
| Weighted average number of shares outstanding: | ||||||||
| Basic and Diluted | 16,489 | 12,138 | ||||||
| Comprehensive loss: | ||||||||
| Net loss | $ | (14,873 | ) | $ | (10,353 | ) | ||
| Unrealized (loss) gain on currency translation adjustment | (79 | ) | 354 | |||||
| Comprehensive loss | $ | (14,952 | ) | $ | (9,999 | ) | ||
The accompanying notes are an integral part of these consolidated financial statements.
VISLINK TECHNOLOGIES, INC. (f/k/a xG TECHNOLOGY, INC.) AND SUBSIDIARIES
CONSOLIDATED BALANCE SHEETS
(IN THOUSANDS EXCEPT SHARE AND PER SHARE DATA)
| December 31, | ||||||||
| 2018 | 2017 | |||||||
| ASSETS | ||||||||
| Current assets | ||||||||
| Cash | $ | 2,005 | $ | 2,799 | ||||
| Accounts receivable, net | 6,191 | 8,337 | ||||||
| Inventories, net | 13,050 | 14,753 | ||||||
| Prepaid expenses and other current assets | 780 | 626 | ||||||
| Total current assets | 22,026 | 26,515 | ||||||
| Property and equipment, net | 2,096 | 3,237 | ||||||
| Intangible assets, net | 4,691 | 6,894 | ||||||
| Total assets | $ | 28,813 | $ | 36,646 | ||||
| LIABILITIES AND STOCKHOLDERS’ EQUITY | ||||||||
| Current liabilities | ||||||||
| Accounts payable | $ | 7,072 | $ | 10,918 | ||||
| Accrued expenses | 2112 | 3,150 | ||||||
| Convertible notes payable | — | 2,000 | ||||||
| Convertible promissory notes, net of discount of $16 and $-0-, respectively | 400 | — | ||||||
| Due to related parties | 361 | 998 | ||||||
| Customer deposits and deferred revenue | 1,574 | 634 | ||||||
| Obligation under capital lease | — | 18 | ||||||
| Derivative liabilities | 1,118 | 2,399 | ||||||
| Total current liabilities | 12,637 | 20,117 | ||||||
| Obligation under capital lease, net of current portion | — | 30 | ||||||
| Convertible promissory notes, net of discount of $47 and $-0-, respectively | 5,886 | — | ||||||
| Total liabilities | 18,523 | 20,147 | ||||||
| Commitments and contingencies | ||||||||
| Stockholders’ equity | ||||||||
| Preferred stock – $0.00001 par value per share: 10,000,000 shares authorized at December 31, 2018 and 2017; -0- shares issued and outstanding as of December 31, 2018 and 2017 |
— | — | ||||||
| Common stock, – $0.00001 par value per share, 100,000,000 shares authorized, 18,776,980 and 14,897,392 shares issued and 18,776,978 and 14,897,390 outstanding at December 31, 2018 and 2017, respectively | — | — | ||||||
| Additional paid in capital | 244,562 | 235,819 | ||||||
| Accumulated other comprehensive income | 275 | 354 | ||||||
| Treasury stock, at cost – 2 shares as of December 31, 2018 and 2017, respectively | (22 | ) | (22 | ) | ||||
| Accumulated deficit | (234,525 | ) | (219,652 | ) | ||||
| Total stockholders’ equity | 10,290 | 16,499 | ||||||
| Total liabilities and stockholders’ equity | $ | 28,813 | $ | 36,646 | ||||
The accompanying notes are an integral part of these consolidated financial statements.
Reconciliation of GAAP to Non-GAAP Results
Our financial statements are prepared in accordance with US GAAP on a basis consistent for all periods presented. In addition to results reported in accordance with US GAAP, we use non-GAAP financial measures as supplemental indicators of our operating performance. We disclose non-GAAP measures as we believe that these measures provide better information on actual operating results.
Readers are cautioned that non-GAAP financial measures do not have any standardized meaning prescribed by US GAAP and therefore may not be comparable to similar measures presented by other companies.
VISLINK TECHNOLOGIES, INC. (f/k/a xG TECHNOLOGY, INC.)
RECONCILIATION OF GAAP to NON-GAAP RESULTS
QUARTER ENDING DECEMBER 31, 2018
| Stock | Non | |||||||||||||
| GAAP | Option | One-Time | Discontinued | GAAP | ||||||||||
| In thousands of US$ | Q4 | Expense | Expenses | Operations | Q4 | |||||||||
| Revenue | $10,812 | 138 | – | $10,950 | ||||||||||
| Gross margin | 47.4% | 48.1% | ||||||||||||
| Cost of revenue and operating expenses | ||||||||||||||
| Cost of components and personnel | 5,685 | 5,685 | ||||||||||||
| Inventory valuation adjustments | 120 | 120 | ||||||||||||
| General and administrative expenses | 5,238 | (358) | (34) | (416) | 4,430 | |||||||||
| Research and development expenses | 1,220 | (257) | – | (65) | 898 | |||||||||
| Impairment charge | 245 | (245) | – | |||||||||||
| Amortization and depreciation | 578 | – | – | (473) | 105 | |||||||||
| Total cost of revenue and operating expenses | 13,086 | (615) | (279) | (954) | 11,238 | |||||||||
| Income (loss) from operations | (2,274) | 615 | 417 | 954 | (288) | |||||||||
| Other income (expense) | ||||||||||||||
| Changes in fair value of derivative liabilities | 684 | 684 | ||||||||||||
| Loss on debt extinguishment | (1,060) | 1,060 | – | |||||||||||
| Other expense | 95 | 95 | ||||||||||||
| Interest expense | (399) | – | 396 | – | (3) | |||||||||
| Total other income (expense) | (680) | – | 1,456 | – | 776 | |||||||||
| Net income (loss) | $(2,954) | $615 | $1,873 | $954 | $488 | |||||||||
| EBITDA | $(1,977) | $615 | $1,477 | $481 | $596 | |||||||||
VISLINK TECHNOLOGIES, INC. (f/k/a xG TECHNOLOGY, INC.)
RECONCILIATION OF GAAP to NON-GAAP RESULTS
2018
| Stock | Non | |||||||||||||
| GAAP | Option | One-Time | Discontinued | GAAP | ||||||||||
| In thousands of US$ | 2018 | Expense | Expenses | Operations | 2018 | |||||||||
| Revenue | $38,294 | 138 | (447) | $37,985 | ||||||||||
| Gross margin | 49.9% | 49.7% | ||||||||||||
| Cost of revenue and operating expenses | ||||||||||||||
| Cost of components and personnel | 19,192 | (84) | 19,108 | |||||||||||
| Inventory valuation adjustments | 473 | – | 473 | |||||||||||
| General and administrative expenses | 21,817 | (1,750) | (178) | (2,558) | 17,331 | |||||||||
| Research and development expenses | 7,873 | (1,978) | – | (1,881) | 4,014 | |||||||||
| Impairment charge | 413 | – | (413) | – | ||||||||||
| Amortization and depreciation | 2,953 | – | – | (1,341) | 1,612 | |||||||||
| Total cost of revenue and operating expenses | 52,721 | (3,728) | (178) | (6,277) | 42,538 | |||||||||
| Income (loss) from operations | (14,427) | 3,728 | 316 | 5,830 | (4,553) | |||||||||
| Other income (expense) | ||||||||||||||
| Changes in fair value of derivative liabilities | 3,186 | 3,186 | ||||||||||||
| Loss on debt extinguishment | (1,060) | 1,060 | – | |||||||||||
| Other expense | 146 | 146 | ||||||||||||
| Interest expense | (2,718) | – | 2,512 | – | (206) | |||||||||
| Total other income (expense) | (446) | – | 3,572 | – | 3,126 | |||||||||
| Net income (loss) | $(14,873) | $3,728 | $3,888 | $5,830 | $(1,427) | |||||||||
| EBITDA | $(9,202) | $3,728 | $1,376 | $4,489 | $391 | |||||||||